

In a world of instant gratification, many of us don’t have time to scroll through tables of data to deduce how Strasbourg’s style has changed under new manager Patrick Vieira.
Surely there is a quicker way to find the answer?
Luckily for you, The Athletic have added another visualisation to our suite.
Polar charts have become synonymous with football analytics in recent years and can provide a simple, intuitive way to assess a player’s profile at a glance. At the team level, you may be familiar with The Athletic’s playstyle wheels, which similarly outline how a side plays by condensing multiple metrics into an aesthetically pleasing graphic.
Where previously these playstyle wheels used granular data to interrogate each Premier League side in depth, here we can provide you with greater breadth to determine how each team look to play compared with Europe’s top seven leagues — that is, the Premier League, Bundesliga (Germany), La Liga (Spain), Ligue 1 (France), Serie A (Italy), Eredivisie (Netherlands), and Primeira Liga (Portugal).
To save you some time, The Athletic has transformed some of Opta’s metrics (via FBref) to create a brand new playstyle wheel — broken down into defence, possession, progression and attack metrics.
Crucially, these metrics are presented using football language that we can all relate to — so you can glance at “chance prevention” with ease and not have to squint to understand what is meant by “npxGA per 90”.
While the better teams are typically more likely to rank highly on these measures, the metrics included are largely focused on style more than success. Think more “what does this team do a lot of” than “how much better is this team than others”.
Like many of these charts, the output is presented as percentiles, which compares the team in question with the remaining group — for example, the 90th percentile would mean that the team’s metric was higher than 90 per cent of Europe’s top seven leagues. Simple.
Sure, they might not cover every wrinkle of a team’s approach in and out of possession, but treat these visualisations as an appetiser, a canape, an amuse-bouche to whet your appetite for further investigation on a team’s playing profile.
Let’s work through the metrics…
Defence
Starting out of possession. First, we have a team’s Chance prevention, which doesn’t need much explaining. This is simply non-penalty expected goals conceded per 90 minutes and is reverse scored — meaning teams that give up fewer chances will have a higher percentile rank.
Next, we have Intensity. This reflects the volume of opposition touches a team allows before making a tackle in the attacking two-thirds of the pitch. Much like the well-established PPDA measure, a lower value — and therefore, higher percentile rank — shows greater intensity to press higher up the pitch to regain possession.
Let’s run through an example. Arsenal’s defensive output is among the best in Europe, with only Inter Milan, Bayern Munich and Sporting Lisbon conceding fewer chances across the top seven leagues (Chance prevention, 97 out of 99).
Likewise, their intense press has been termed “a work of art” at times this season, with few teams showing more aggression and organisation out of possession than Mikel Arteta’s side (Intensity, 93 out of 99).

Finally, we can determine a team’s inclination to squeeze the pitch with a High line in defence — typically reserved for the dominant sides in Europe.
This is calculated by looking at the volume of offsides provoked + through balls conceded + sweeper keeper actions made (i.e. defensive actions made outside of the penalty area) as a share of all opposition passes made into the final third.
Simply, if you have more offsides, allow more balls behind your defence and ask your keeper to jump out a lot, that’s a good proxy for a high line.
Arsenal don’t have the highest line in Europe (High line, 81 out of 99). They don’t even have the highest line in the Premier League. That’s right, those numbers are reserved for Aston Villa and Tottenham Hotspur — two teams who are staunchly dedicated to a squeeze up the pitch with plenty of space left behind.
Having those two sides at the top of the ranks shows that this metric shakes out rather nicely.
Possession
Now we’re focusing on a team’s style on the ball, it makes sense to work our way up the field.
Starting with a side’s likelihood of engaging in Deep build-up play from the back. This is simply calculated as a reverse scoring of a goalkeeper’s launch rate (passes longer than 40 yards) as a share of their total passes (goal kicks and open-play passes) made.
If a manager wants a patient possession approach from the back, you can be confident that he will ask his goalkeeper to keep those passes short.
When Paris Saint-Germain, Brighton, Liverpool, and Barcelona are among the highest ranking for “Deep build-up”, it shows that this metric passes the eye test.
Using Xabi Alonso’s Bayer Leverkusen as our case study, you can see that the possession metrics match the Spaniard’s desire to keep the ball on the deck, with a Deep build-up rating of 92 out of 99.

Similarly, Leverkusen’s Press resistance is among the best in Europe (89 out of 99), calculated by a team’s volume of touches in their first two-thirds of the pitch per opponent tackle made. A high rank shows how well a team can evade pressure as they work the ball through the thirds. Unsurprisingly, Manchester City come out on top in this metric.
Finally, we have Possession. This is pretty on the nose, simply outlining which teams have a higher share of the ball. While possession can be a misleading statistic to determine success, it simply outlines each team’s stylistic approach.
Across Europe, only PSG, Barcelona, Manchester City and PSV Eindhoven have a higher share of possession than Alonso’s table-topping Leverkusen.
Progression
Now it gets more fun.
Before we reach the attack, it is useful to see how teams like to progress forward into dangerous zones.
For this, we can look at Central progression to see how likely a side is to funnel their possession towards goal. Typically, the better teams don’t simply get it wide and aimlessly cross it in. Sure, they might work the ball wide and stretch the opposition back line, but if an opportunity is not available, they might then pass back and recycle possession through the central third before working an opening between the lines. If you’re thinking of Pep Guardiola’s Manchester City, you’re on the right lines.
Therefore, this metric is calculated as the inverse of a side’s volume of crosses per 100 passes, with higher ranks showing a more considered attacking approach than just whipping it into the penalty area at the soonest opportunity.
A great case study is Bologna, who are firmly in the race for a top-four spot in Serie A with their dominant, progressive style under Thiago Motta. Despite having the third-highest possession share in Italy’s top flight, only Frosinone have attempted fewer crosses than Bologna’s 14 per 90.
While the likes of Alexis Saelemaekers and Dan Ndoye will keep their width on the flanks, they will be more likely to dribble into central areas or make out-to-in runs into space to receive through-balls — giving Bologna a high Central progression ranking (96 out of 99).
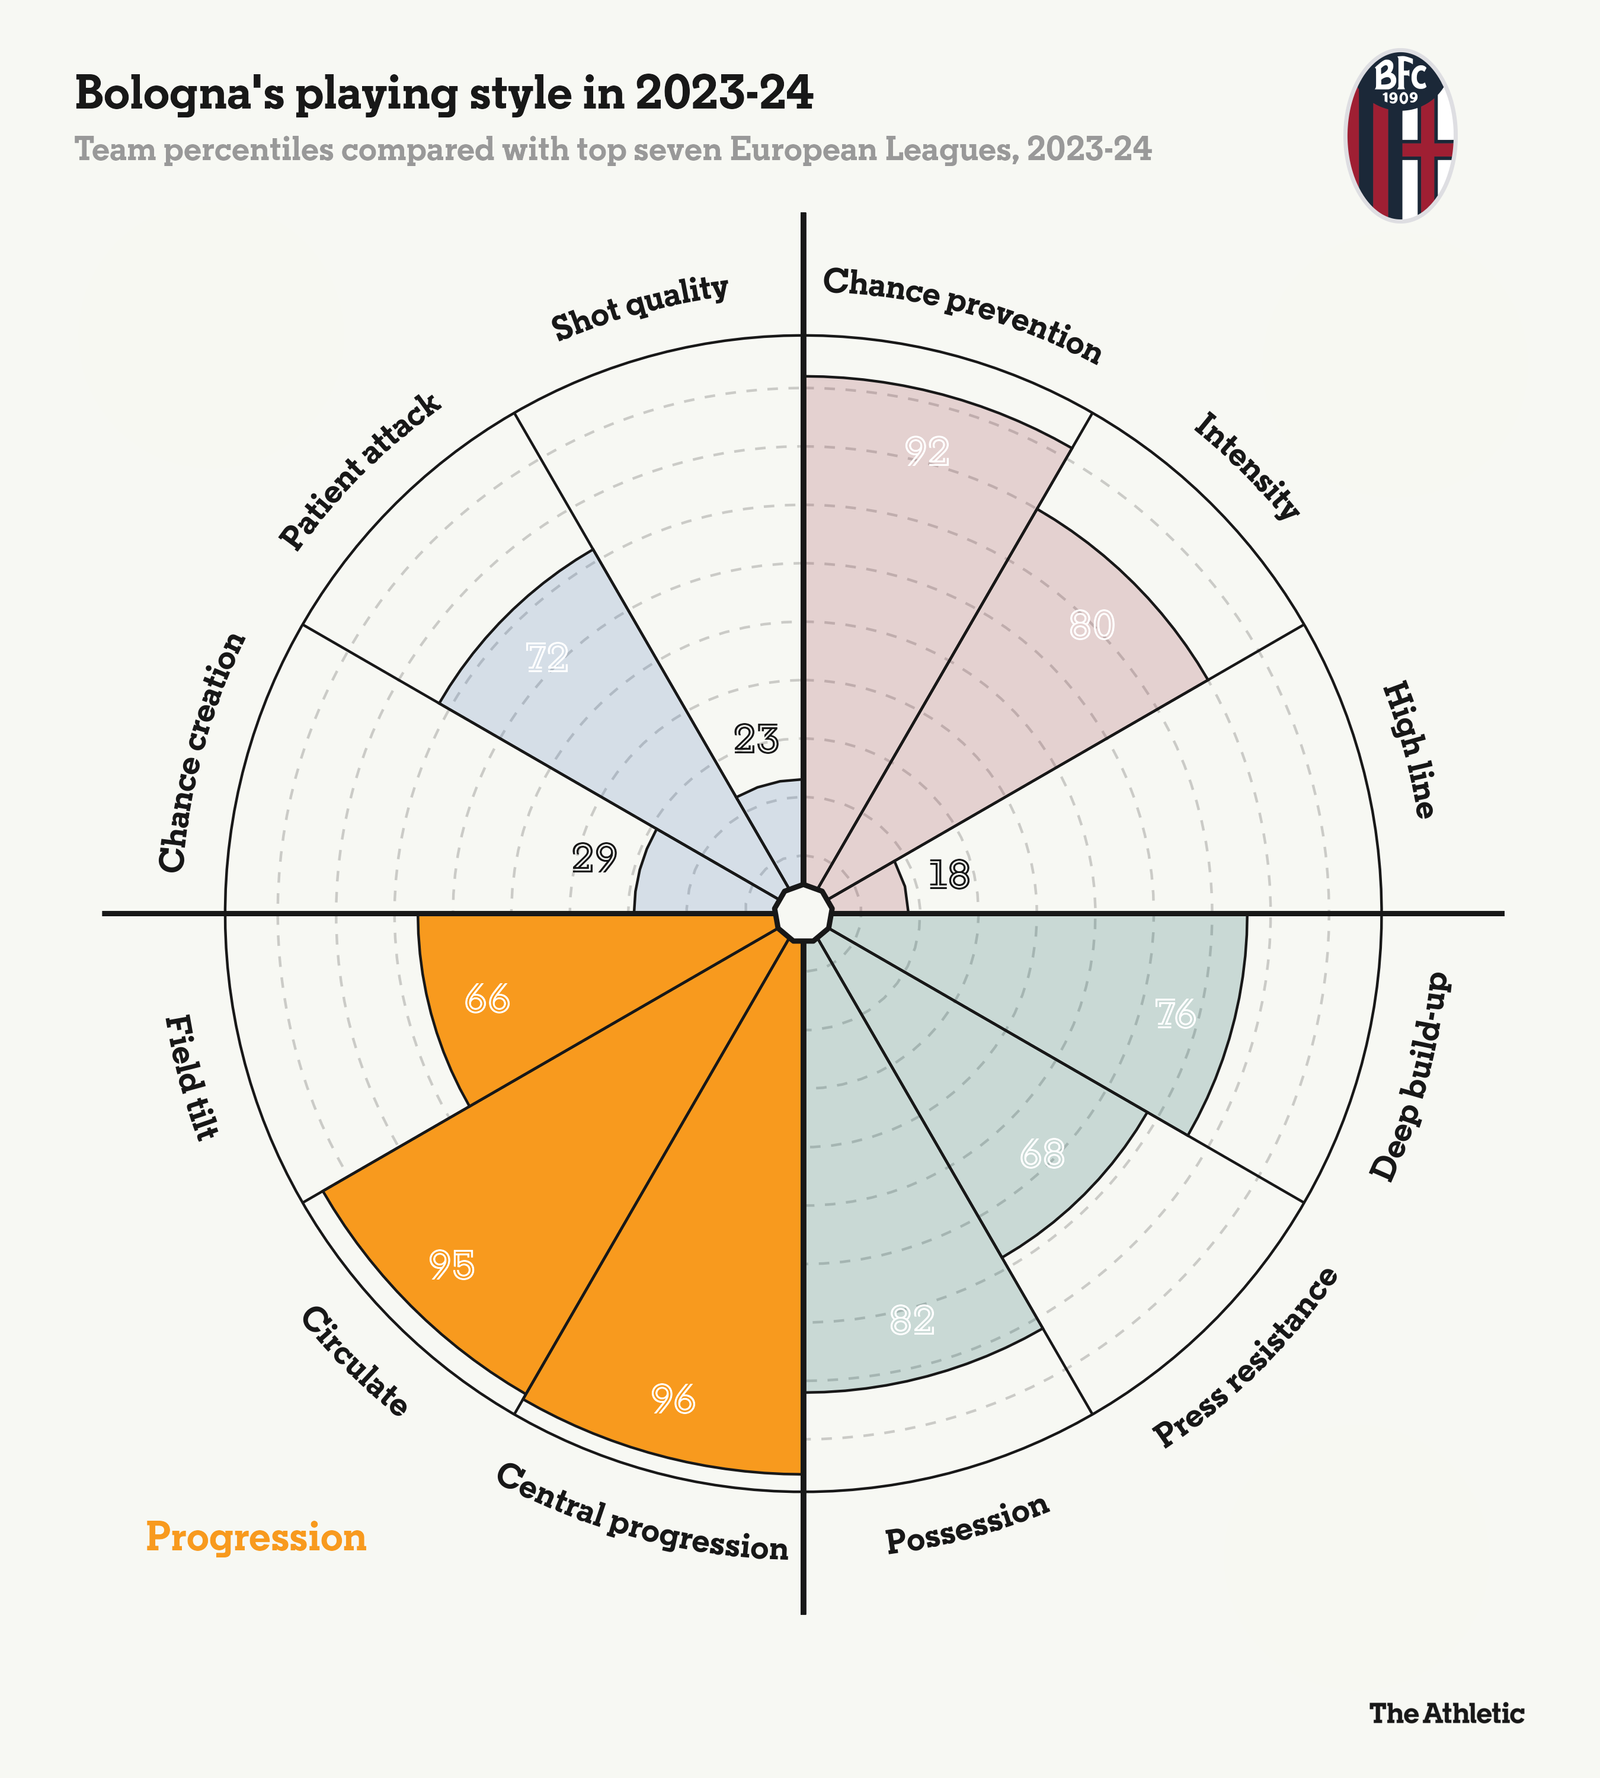
Next, we have a side’s inclination to Circulate the ball, with Motta’s side again ranking highly (95 out of 99). This metric is the inverse of a side’s directness in possession, calculated as the progressive distance (in yards) gained from a team’s passes and carries as a share of their total distance accrued by these actions.
A higher “circulate” ranking reflects a side that is more willing to work the ball from side-to-side in order to find an opening, rather than lump it forward — or go on a mazy run — at the first opportunity.
Finally, we come to Field tilt — a well-established metric to show a side’s territorial dominance by calculating the share of possession in each side’s respective attacking third.
As you can see above, Bologna’s ball-dominant style has not quite commanded the same authority at the top end of the pitch (Field tilt, 66 out of 99) that is typically observed among the elite sides.
Attack
You will be very familiar with this section.
It is impossible not to include how often a team generates their opportunities in attack, so Chance creation is simply a team’s non-penalty expected goals (xG) per 90 minutes. Interestingly, it is Peter Bosz’s high-energy style that has made PSV Eindhoven the most potent side in Europe’s top seven leagues, with no team creating more than their 2.7 xG per 90 this season.
From PSV to French champions PSG, who rank very highly on the next metric.
Patient attack is calculated as the volume of shots taken per 100 attacking touches in the final third — with Luis Enrique’s ball-dominant side regularly looking to work a clear opening against a low defensive block packed with opposition defenders. If that doesn’t work, just give it to Kylian Mbappe.
Teams who rank low on this measure will be far more direct going forward, either with a quick gear change or strong counter-attacking play — think RB Leipzig, Juventus or Liverpool.
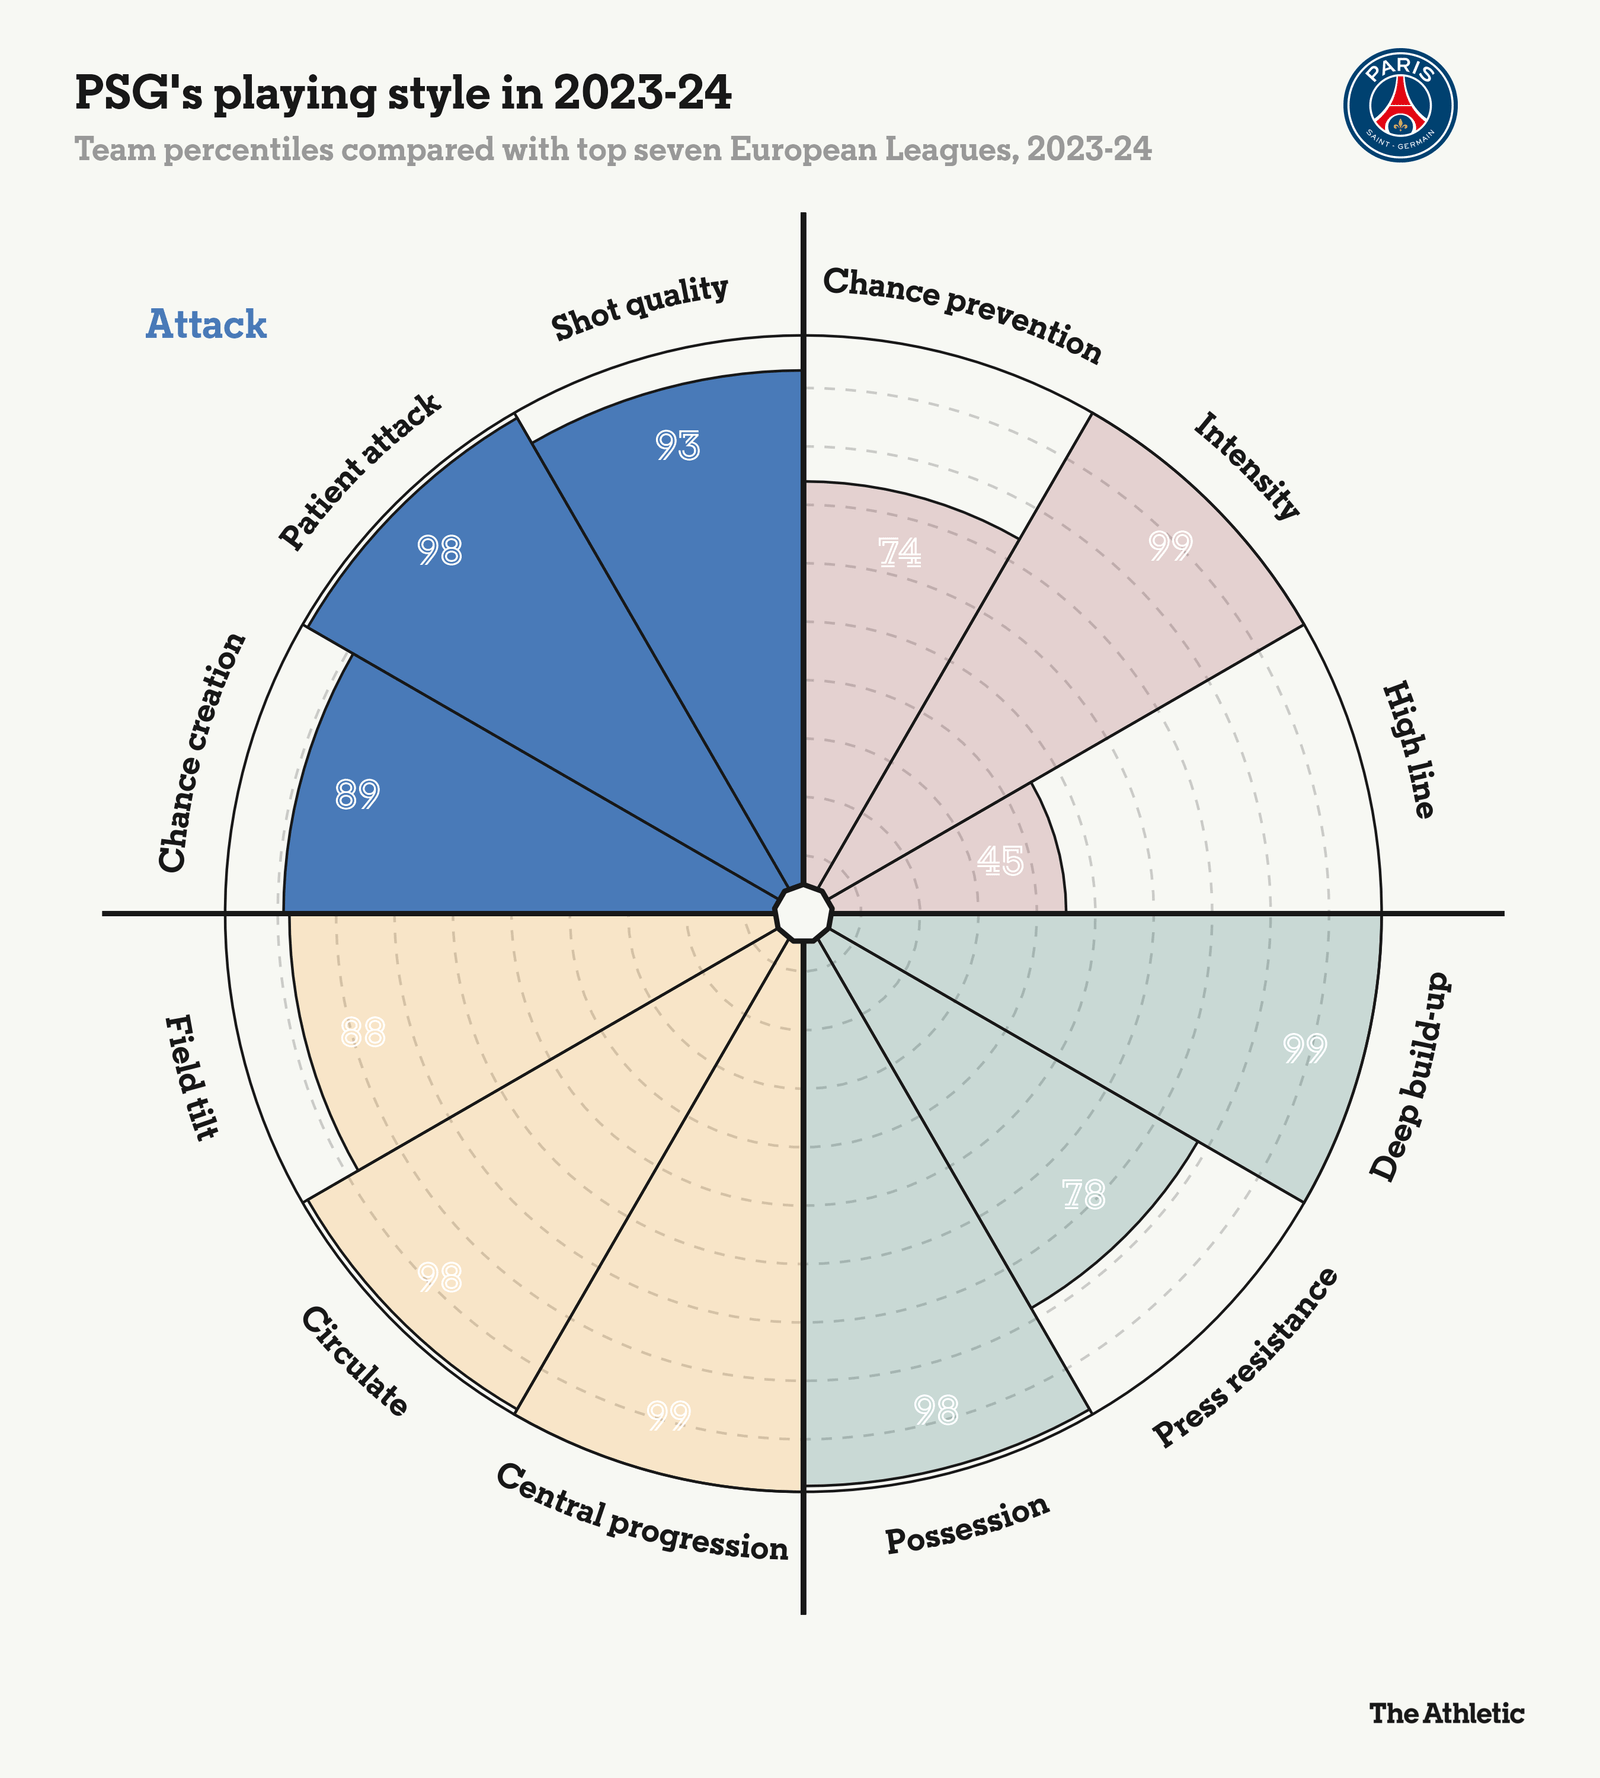
Finally, we come to Shot quality. Teams who work the clearest openings are more likely to score goals, so this measure is the average xG value of a given shot that is taken. A high volume of shots is great, but the elite teams are more likely to have the highest quality efforts on goal, as PSG’s rating of 93 out of 99 reveals.
Look out for more of these visualisations on The Athletic, whether it is team profiling, a tactical deep dive, or a manager search ahead of the summer. If you have any thoughts, feel free to post them in the comments section below.
(Top photo: Alex Livesey/Getty Images)
Read the full article here